Pascal's Triangle
Check out this link for other implementations and thoughts:
Pascal's Triangle connects to the Binomial Theorem (originally proved by Sir Isaac Newton) and to numerous topics in probability theory. The triangular and tetrahedral number sequences may be discovered lurking in its columns.
We will create a functions which will help to build successive rows of Pascal's Triangle. By prepending and appending a zero element and adding vertically, a next row is obtained. For example, from [1] we get [0, 1] + [1, 0] = [1, 1]. From [1, 1] we get [0, 1, 1] + [1, 1, 0] = [1, 2, 1] and so on.
# simple Pascal's triangle realisation
# populated with Pascal's triangle rows give an infinite sequence of finite sequences
# this implementation support few printing styles


import math

class PascalsTriangle():

    def __init__(self, rowcount):
        self.rowcount = rowcount
        self.pt = self._create()

    def _create(self):
        """Create an empty list and then append lists of 0s, each list one longer than the previous"""
        return [[0] * r for r in range(1, self.rowcount + 1)]

    def populate(self):
        """Populate an uninitialized list with actual values"""
        for r in range(0, len(self.pt)):
            for c in range(0, len(self.pt[r])):
                self.pt[r][c] = math.factorial(r) / (math.factorial(c) * math.factorial(r - c))

    def print_left(self):
        """Prints the triangle in a left-aligned format to demonstrate data structure"""
        for r in range(0, len(self.pt)):
            for c in range(0, len(self.pt[r])):
                print('{:>4}'.format(int(self.pt[r][c])), end="")
            print()

    def print_centre(self):
        """Prints the triangle in a conventional centred format"""
        inset = int(((((len(self.pt) * 2) - 1) / 2) * 3))
        for r in range(0, len(self.pt)):
            print(" " * inset, end="")
            for c in range(0, len(self.pt[r])):
                print('{:>3}   '.format(int(self.pt[r][c])), end="")
            print()
            inset -= 3
triangle = PascalsTriangle(13)
triangle.print_centre()
triangle.populate()
triangle.print_centre()
Notice the triangular numbers (1, 3, 6, 10...) and tetrahedral number sequences (1, 4, 10, 20...) appear in the slanted columns. learn more...
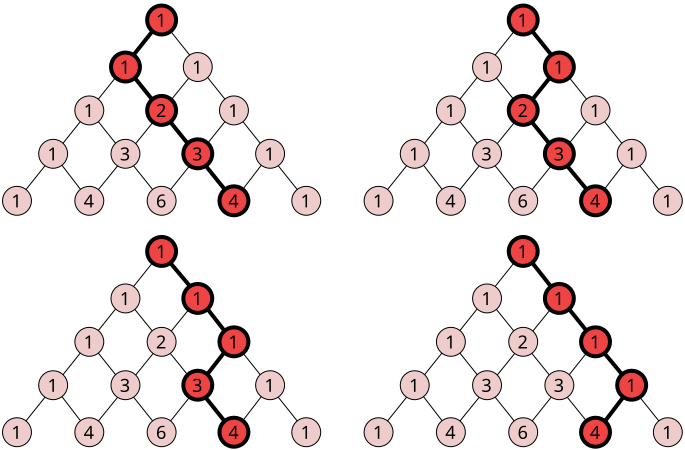
Each number in Pascal's Triangle may be understood as the number of unique pathways to that position, were falling balls introduced through the top and allowed to fall left or right to the next row down. This apparatus is sometimes called a Galton Board.
For example, a ball could reach the 6 in the middle of the 5th row going 1,1,2,3,6 in four ways (counting left and right mirrors), or 1,1,1,3,6 in two ways. The likely pattern when many balls fall through this maze will be a bell curve.
Pascal's Triangle can be represented as oriented weighted graph. We will use networkx DiGraph library to build a tree structure from our triangle. Change plot size by matplotlib fig_size and plot graph using networkx builtin plotting methods in next order: draw_networkx_nodes, draw_networkx_edges, draw_networkx_labels.
# networkx Pascal's triangle realisation
# populated with Pascal's triangle rows give an infinite sequence of finite sequences
# fillin graph objects from populated triangle
# include plotting method with colorisation support


import networkx as nx
import matplotlib.pyplot as plt


class GraphTriangle(PascalsTriangle):

    def __init__(self, rowcount):
        super(GraphTriangle, self).__init__(rowcount)
        self.populate()
        self.G = nx.DiGraph()
        self._create_root_node()
        self._fill_graph()

    def _create_root_node(self):
        self.G.add_node(f"{0}_{0}", weight=1)

    def _fill_graph(self):
        """Fill graph enumerating throw previously generated list respecting to weight attribute"""
        for y, l in enumerate(self.pt[1:]):
            row_len = len(l)
            for x, w in enumerate(l):
                self.G.add_node(f"{y+1}_{x}", weight=w)
                if x == 0:
                    self.G.add_edge(f"{y}_{x}",   f"{y+1}_{x}")
                elif x == row_len-1:
                    self.G.add_edge(f"{y}_{x-1}", f"{y+1}_{x}")
                else:
                    self.G.add_edge(f"{y}_{x}",   f"{y+1}_{x}")
                    self.G.add_edge(f"{y}_{x-1}", f"{y+1}_{x}")

    def plot_digraph(self, color_node=False):
        """PLot graph with pydot, set fig_size and draw nodes, edges and labels"""
        labels = {n:int(w['weight']) for n, w in self.G.nodes(data=True)}

        node_colors='#eecccc'
        if color_node:
            node_colors = [w for r in digraph.pt for w in r]
        pos = nx.drawing.nx_pydot.pydot_layout(self.G, prog='dot')

        box_size = len(self.pt) + 1
        box_size = 9 if box_size < 9 else box_size
        plt.figure(1,figsize=(box_size,box_size))

        nx.draw_networkx_nodes(self.G, pos, node_size=2000,
                               edgecolors='#000000', linewidths=1,
                               node_color=node_colors, vmin=min(node_colors), vmax=max(node_colors),
                               cmap='Set3')
        nx.draw_networkx_edges(self.G, pos, edgelist=self.G.edges(), arrows=False, width=1)
        nx.draw_networkx_labels(self.G, pos, labels=labels, font_size=18);

        plt.show()
digraph = GraphTriangle(9)
type(digraph.G)
digraph.plot_digraph()

digraph.plot_digraph(color_node=True)

Comments
comments powered by Disqus